|
|
|
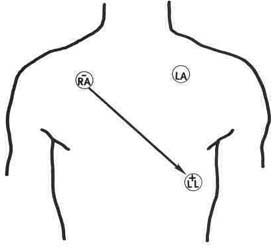
Figure 5.1 Standard lead ll. |
| Contents | Previous | Next |
The patient in a critical care unit is monitored with specialized equipment to maintain careful surveillance of changes in cardiac activity. The bedside equipment, with an oscilloscope, monitoring leads, and a recording device, or write out, permits a constant vigil of the heart's activity. Changes can be recorded and analyzed immediately. Cardiac monitoring means watching and analyzing. When a recording is made on a monitor strip, the analysis is done in an orderly fashion:
The choice of a monitoring lead is determined by unit protocol. Consistency is necessary for comparison. The bipolar system in general use consists of three electrodes:
The negative electrode right arm (RA), placed in the right clavicular area;
The positive electrode left leg (LL), placed at the sixth or seventh intercostal space in the anterior axillary line;
The ground (G) electrode, often placed in the left clavicular or right abdominal area.
|
|
|
Figure 5.1 Standard lead ll. |
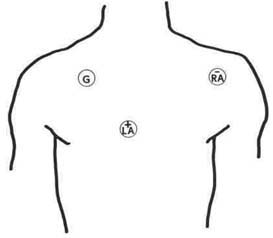
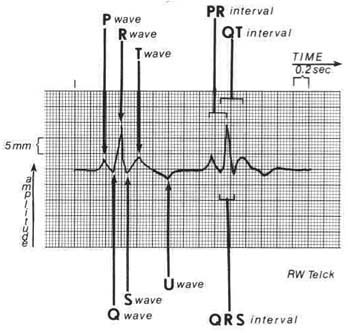
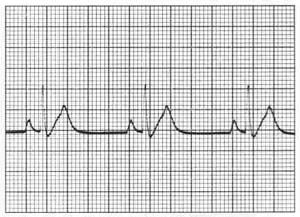
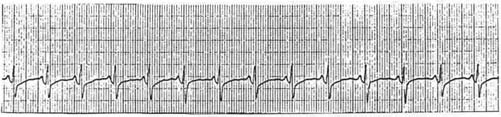
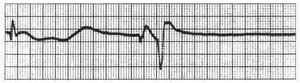
This is a standard lead II, frequently used for bedside monitoring (Fig. 5.1). A modification of chest lead V1, termed MCL1, is also used in some protocols. Electrode placement for MCL1 places the negative electrode on the upper left chest, under the left clavicle, and places the positive electrode in the fourth intercostal space at the right sternal border. The ground electrode is at the sixth or seventh intercostal space in the anterior axillary line. Lead II and MCL1 (Fig. 5.2) are in common use for bedside monitoring because they most consistently show the p wave. Bedside monitor strips are run on electrocardiogram (ECG) paper, a graphic paper composed of small and large sections called blocks. Each large block represents .20 seconds; 300 large blocks represent one minute (.20 x 300 = 60 seconds). Each small block represents .04 seconds; 1500 small blocks represent one minute (.04 x 1500 = 60 seconds). Standard recording speed is 25 mm per second. Standardization provides identical information each time a strip is recorded (Fig. 5.3).
|
|
|
Figure 5.2 MCL1. |
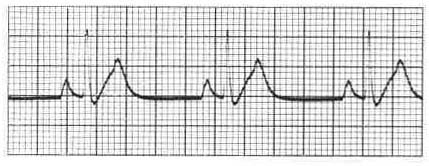
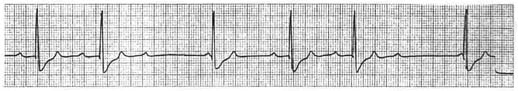
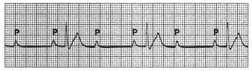
When the sinus node is the acting pacemaker and the impulse is carried in an orderly pattern through the conduction system, between 60 and 100 times per minute, it is termed normal sinus rhythm (NSR) (Fig. 5.4). In this rhythm, the ventricular rate and the atrial rate are identical (Table 5.1). A dysrhythmia (also called an arrhythmia) occurs when this orderly pattern is disrupted.
|
|
|
Figure 5.3 ECG monitor strip. |
| Table 5.1 Waveforms of the ECG | |||
| Wave | Normal Time Frame | In NSR | |
| P wave | .06-.12 seconds | Precedes QRS | |
| QRS | .06-.10 seconds | Follows each QRS | |
| T wave | .16 seconds | Follows end of QRS complex | |
| PR interval | .12-.20 seconds | No variance from complex to complex | |
| QT interval at HR of 72 bpm | .30-.38 seconds Variance with heart rate | Should not vary in timing between beats, about one-half the R-R interval | |
| R-R | varies with HR | Should not vary between beats | |
Dysrhythmias may be classified by site of origin or by mechanism (Table 5.2). If the heart rhythm is abnormal, the rate at which it beats is an important measurement for classifying the abnormality. Dysrhythmias may be divided into two groups: those that require emergency intervention and those that do not. Dysrhythmias requiring emergency intervention are considered life threatening. Ventricular fibrillation and asystole are life-threatening dysrhythmias. If the dysrhythmia is not life threatening, there is time for recording a strip and evaluating action to be taken.
|
|
Figure 5.4 Normal sinus rhythm. |
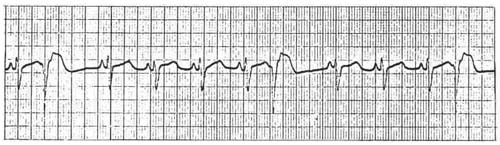
Sinus bradycardia is a heart rate of less than 60 beats per minute (bpm). The sinus node is the pacemaker at a regular rate,' but a slowed one. Young people and athletes, runners in particular, normally have heart rates of 50 bpm.
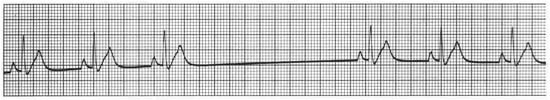
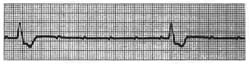
When the stimulus from the sinus node fails to occur at its regular interval, it is termed sinus arrest (Fig. 5.6).
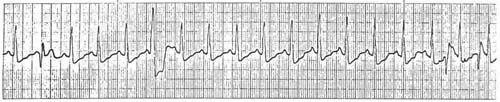
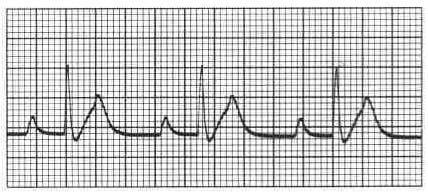
Sinus tachycardia is a heart rate greater than 100 bpm (Fig. 5.7). The sinus node is the pacemaker at a regular but faster rate.
| Table 5.2. Classification of Dysrhythmias |
|
Site of origin:
Mechanism:
|
|
|
|
Figure 5.5 Sinus bradycardia. |
This is a beat from an impulse formed prematurely in atrial tissue. The impulse is said to be from an ectopic focus. It appears early in the cycle. This takeover of the sinus pacemaker occurs for a single beat (Fig. 5.8).
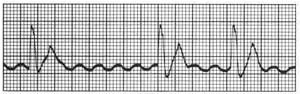
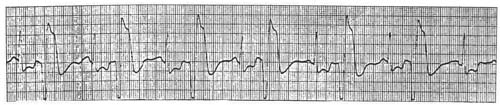
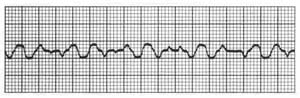
When many ectopic foci in the atria generate impulses at a rapid rate in a disorganized fashion, it is termed atrial fibrillation (Fig. 5.9). Normal p waves are not seen, and the ventricular response rate varies between fast and slow. The atrial irregularity is termed f waves due to the irregular movement evident in the baseline. This arrhythmia can be identified quickly by its irregular appearance.
|
|
|
Figure 5.6 Sinus arrest. |
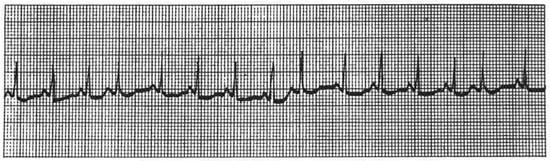
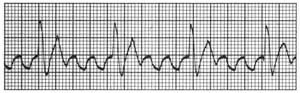
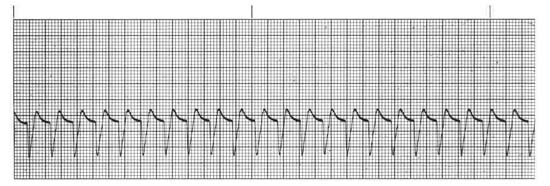
Rapid, regular firing of an ectopic focus in the atrium is termed atrial flutter (Fig. 5.10). The impulse does not arise in the sinoatrial (SA) node. Unlike fibrillation, there is an orderly pattern to flutter waves, and they are regular in timing. The typical appearance of these atrial impulses is a saw-toothed configuration with an atrial rate of 250-350 per minute. These impulses are carried to the atrioventricular (AV) node, which acts as a filter, blocking the large number and preventing conduction to the ventricles. The ratio of conducted beats may be 1:1, 2:1, 3:1, 4:1. The conduction ratio is usually, but not always, stable, so the ventricular response rate is most frequently regular.
|
|
|
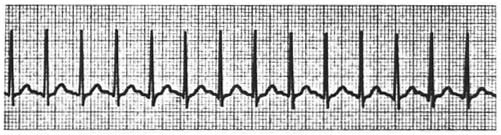
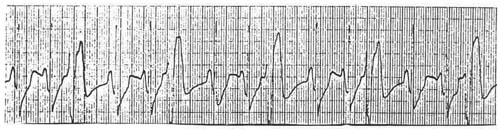
Figure 5.7 Sinus tachycardia. |
PAT occurs with an abrupt onset of tachycardia from an ectopic focus above the ventricles (Fig. 5.11). Another name for this arrhythmia is paroxysmal su-praventricular tachycardia (PSVT). A tachycardia that is rapid and regular in rhythm and that may originate in an ectopic atrial site or in the AV junction is termed supra ventricular tachycardia (SVT). The heart rate is regular, exceeding 150 (150-250 bpm). PAT may occur in young people with no apparent heart disease. The attack ends as abruptly as it begins. The PAT may occur in a timeframe of minutes or hours. Conduction to the ventricles is through normal pathways. PAT usually is with 1:1 conduction. Occasionally, beats may be blocked; the impulse is not conducted to the ventricles. This is termed PAT with block. The atrial rate is two times the ventricular rate, but the ventricular rate continues to be regular when it is a 2:1 block. The block may be 3:1, 4:1, or variable block.
The AV junction is the entry unit for conduction to the ventricles. Ectopic impulses may originate in tissue near this junction. These ectopic beats are termed premature Junctional contractions (Fig. 5.12). When this ectopic focus initiates an impulse, it may spread to the atria with retrograde stimulation and forward to the ventricles. If p waves are identified, they may be inverted, directly in front of, buried within, or directly after the QRS complex, or they may be completely absent.
When the primary pacing system of the SA node fails, the "backup" system, or secondary backing system, takes the lead (Fig. 5.13). The AV Junctional tissue can become the heart's pacer. The intrinsic rate of the junction is 40-60 bpm. Occasionally, the Junctional rate becomes rapid, and Junctional tachycardia with a rate of 100-140 bpm will occur.
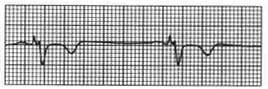
When an ectopic focus fires an impulse in the ventricle, the resultant contraction is called a PVC (Fig. 5.14). PVCs occurring singly are usually considered benign, depending on the situation; however, when they occur more frequently, from differing ectopic foci, in pairs, or in runs called couplets, they are more threatening. The single PVC bears watching; multiform complexes (Fig. 5.15), couplings, and larger numbers should be treated.
Bigeminy refers to one normal beat alternating with a PVC (Fig. 5.16). Trigeminy, as the name implies, is a repeating pattern of two normal beats to one PVC (Fig. 5.17).
|
|
|
Figure 5.8 Atrial premature complex. |
|
|
|
Figure 5.9 Atrial fibrillation. |
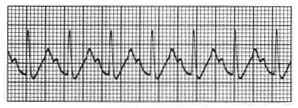
VT refers to a situation in which ectopic foci in the ventricles create a long series of beats at a very rapid rate, usually 100-200 bpm (Fig. 5.18).
|
|
|
Figure 5.10 Atrial flutter. |
The ventricular rate is regular. A rapid ventricular ectopic rhythm may lead to pump failure and loss of consciousness.
This dysrhythmia is life threatening and demands immediate treatment. The dysrhythmia occurs because many ventricular ectopic foci, in complete disarray, are firing impulses. The heart stops contracting effectively. The ECG shows totally irregular small (fine) or large (coarse) waves (Fig. 5.19). The waveforms are irregular in rate, size, and shape. Car-diopulmonary resuscitation with code medications (Section Five) and defibrillation is the treatment.
|
Figure 5.11 Paroxysmal atrial tachycardia. |
|
Figure 5.12 Premature junctional contraction PJC. |
|
Figure 5.13 Junctional rhythm. |
|
Figure 5.14 premature ventricular contraction (PVC).
|
|
Figure 5.15 Multiform PVCs. |
|
Figure 5.16 Bigemeny. |
|
Figure 5.17 Trigemeny. |
|
Figure 5.18 Ventricular tachycardia. |
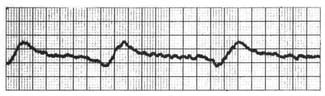
When the electrical conduction system fails completely and the ventricles do not create impulses or respond to impulses from the atria or AV node, standstill, or cardiac arrest, occurs. Agonal rhythm (Fig. 5.20), an extremely slow idioventricular rhythm with widening, bizarre-appearing QRS complexes, may precede asystole (Fig. 5,21). Idioventricular rhythm may be an indication of electromechanical disassociation; ECG complexes appear on the screen, but there are no ventricular contractions. This is a life-threatening rhythm. Cardiopulmonary resuscita-tion (CPR) and code treatments are instigated immediately.
|
|
Figure 5.19 Coarse ventricular fibrillation. |
|
|
Figure 5.20 Agonal rhythm. |
AV block presents in many forms. It may be a temporary condition that bears monitoring or a more serious problem demanding treatment. This block, which may proceed to life-threatening dysrhythmias, must be treated. Impulses from the atria to the ventricles traverse the AV node. In normal sinus rhythm, the impulse is passed to the node, held for a brief period, then passed to the His bundle and the ventricles. A diseased AV node may cause conduction delay or may fail completely to conduct a normal impulse.
|
|
Figure 5.21 Asytole. |
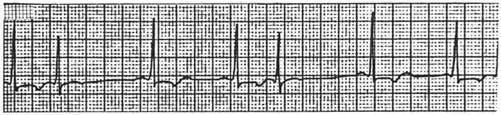
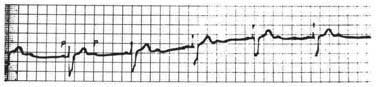
First-degree AV block is a delay in conduction through the node. It appears as a prolonged P-R interval (Fig. 5.22). It is a benign dysrhythmia. Treatment is rarely instituted.
|
|
Figure 5.22 First-degree AV block (with sinus bradycardia ). |
Second-degree AV block describes an intermittent failure in conduction, or sinus rhythm, with some but not all of the p waves conducted through the AV node to the ventricles. There are two types of second-degree block: Mobitz I, commonly referred to as Wenckebach (Fig. 5.23), and Mobitz II (Fig. 5.24).
|
|
Figure 5.23 Second-degree AV block Mobitz l( Wenckebach). . |
|
Figure 5.24 Second-degree AV block Mobitz ll. |
In this type of second-degree block, a progressively prolonged P-R interval occurs until an impulse is blocked at the AV node. The atrial rhythm originates in the SA node and remains regular, but the lengthening P-R interval with the blocked beat produces an irregular R-R interval. This is also usually a benign dysrhythmia, thought to result from a fatigued AV node.
In this type of second-degree block, the P-R interval of the conducted beats is constant, either normal or prolonged (Fig. 5.24). Some beats are blocked; others are conducted. The atrial rhythm is regular, and the ventricular R-R is regular, except for nonconducted beats. This type of second-degree block is more ominous, as it may progress to a more serious third-degree block very quickly.
|
|
Figure 5.25 Second-degree AV block; 2;1 block. |
Occasionally, because of the blocking pattern, it is impossible to measure a constant or a progressively lengthening P-R interval. In this pattern there are no two successive conducted beats. It cannot be labeled Mobitz I or Mobitz II. The pattern occurs as one conducted and one blocked beat. The label is then 2:1 AV block (Fig. 5.25). It is generally agreed that if the QRS complex is of normal duration, it is a form of Mobitz I; if the QRS complex is widened, it is probably a form of Mobitz II.
|
|
Figure 5.26 Third-degree AV block. |
This is a complete heart block, in which all supra-ventricular impulses are blocked at the AV junction (Fig. 5.26). The end result is an AV dissociation, with the atria and ventricles activating independently. An escape mechanism becomes the pacemaker in the ventricles, while the normal pacemaker SA node continues to function for the atria. The p wave shows no relationship to the QRS complex, although both waveforms occur in a regular pattern. The ventricular rate is usually slow and regular, between 30 and 60 bpm. The atrial rate is more rapid, usually above 60 bpm.
Moving down from the AV node to the His bundle, the conduction system is further divided into three parts called fascicles. The right bundle branch, the anterior left bundle branch, and the posterior left bundle branch make up this conduction system, termed trifascicular, which is prone to obstruction of the respective pathways.
|
|
Figure 5.27 Right bundle branch biock. |
This is a more common block. It appears on the V1 lead of the ECG as an RSR1, or an M-shaped complex. It results from normal depolarization of the left ventricle, with stimulation of the right ventricle coming from the left ventricle. The stimulation occurs through the septum at a point below the block (Fig. 5.27).
|
|
Figure 5.28 Left bundle branch block. |
If the common left bundle branch is blocked, it is termed LBBB (Fig. 5.28). The left ventricle is activated by an impulse passed from the right ventricle below the block through the septum. The QRS complex is widened and appears as a notched RR1 configuration on the V5-6 leads of the ECG.
The left bundle branch is divided into an anterior superior branch (fascicle) and a posterior interior branch (fascicle). The fascicles are also subject to blocks. These blocks are termed hemiblocks and can be either left anterior or left posterior, designated by which of the divisions is blocked. The current flows through a normal heart from the base to the apex. This direction of current flow is termed the axis. If the anterior fascicle is blocked, there is said to be a left axis deviation. With a posterior hemiblock, a right axis deviation occurs. Combinations of blocks also occur. A bifascicular block with RBBB and either the anterior or posterior fascicle of the left bundle branch may be blocked, or a trifascicular block may occur, with all three fascicles blocked. It is beyond the scope of this text to include an in-depth discussion of ECGs, axis, dysrhythmia recognition, and treatment. A more thorough discussion of the topic is found in Conover, M. B. (1986). Pocket nurse guide to electrocardiography. St. Louis: C. V. Mosby.
Nursing ManagementThe nurse is responsible for preparing the monitoring equipment and connecting It to the patient (Table 5.3), maintaining the equipment In good working order (Table 5.4), and obtaining good quality recordings (Table 5.5). Major nursing responsibilities are to collect ECG strips and to be aware of changing status due to evolving ischemia. Generally, the nurse needs to:
|
| Table 5.3. Preparation for Electrode Attachment |
|
Prepare the skin at areas of electrode attachment:
|
| Table 5.4. Daily Care of Electrodes |
|
Inspect electrode sites for
Change electrodes as needed. |
| Table 5.5 ECG Monitor Problems | |
| Poor quality tracing | Check electrode sites. |
Artifacts (ascertain that it is indeed an artifact) caused by
|
Eliminate cause—other electrical equipment (x-ray, echo, EKG machines). Change electrode if necessary. Position patient for better conduction. |
| Electrode (lead) reversal causes pattern on oscilloscope to be opposite of the expected. | Correct electrode placement. |
Problems with monitor
|
Always be sure alarms are set; check on this each shift. Set alarms above and below patient's normal. Ascertain good contact via the electrodes. Replace. |