|
|
|
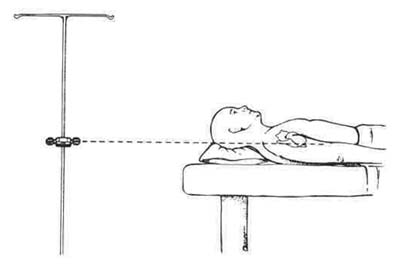
Figure 4.1 Zero port With zero reference point. |
| Contents | Previous | Next |
Hemodynamic monitoring refers to invasive procedures for measurement, assessment, and evaluation of pressure changes brought about by movement of blood within the cardiovascular system. Data can be obtained regarding tissue perfusion, blood volume, vascular capacity, as well as information about preload and after load. This information can be used for an indirect evaluation of myocardial contractility. Hemodynamic events are described as systolic or diastolic. Ventricular events determine this cycle. Systole is ventricular contraction and diastole is ventricular relaxation. Central venous pressure (CVP) catheters and pulmonary artery (PA) catheters are the lines used for measurement of cardiac chamber pressures and cardiac volumes. Arterial lines may be used for systemic pressures.
Central venous pressure monitoring is a measurement of the pressure of blood in the right atrium or vena cava. This is a direct reflection of right ventricular diastolic pressure, or the pumping ability of the right side of the heart. Only the pressure of the right heart can be measured with this catheter because of its position. Left heart function is not detected. An intravenous catheter is threaded into the right atrium or vena cava via a percutaneous or cutdown procedure. Depending on physician preference, the antecubital, saphenous, subclavian, jugular, or innominate vein can be used. Measurement is in centimeters of water (H2O) or millimeters of mercury (Hg). The usual pressure in the right atrium is 0-4 cm H20 or 1-6 mm/Hg. Pressure in the vena cava may be slightly higher. When monitoring the CVP, a baseline measurement is obtained. The significance of the CVP is in the trend of movement upward or downward versus isolated readings. Measurements are obtained when the catheter is connected to either a water manometer with a three-way stopcock or a pressurized transducer system. A transducer is an electrical device used to convert one form of energy into another. It senses pressure (mechanical energy) and transforms it into a waveform (electrical energy). CVP is determined by three factors: vascular tone, blood volume, and right ventricular function.27
Several factors influence CVP: (1) the amount of blood in the ventricle before contraction (preload); (2) the ability of the ventricle to contract (contractility); and (3) the force of resistance against the ejection of blood (after load). A low CVP may result from a reduced venous return (preload) or a hypovolemic state produced by blood or fluid loss or vasodilatation resulting from drugs. An elevation of CVP may result from an increased preload (fluid overload, fluid retention, valvular insufficiency, or right-to-left shunts), or increased pulmonary vascular resistance. Whether a manometer or a transducer is used for CVP measurements, zeroing, or leveling the zero point of the equipment to the reference point on the patient, determines the accuracy of the measurement (Fig. 4.1). The reference point is located midway between the anterior and posterior axilla at the fourth intercostal space (ICS). The zero point is at the level of the right atrium. The patient should be flat in bed when this determination is made. Once zeroed, if a transducer is used, a characteristic atrial waveform (the same waveform as seen when a PA catheter passes the right atrium) will be displayed on the oscilloscope. Changes in the waveform reflect: (1) obstruction of the line (clots); (2) poor catheter position; and (3) change in hemodynamic status.
|
|
|
Figure 4.1 Zero port With zero reference point. |
Preinsertion, prepare both the patient and the equipment for the procedure (Table 4.1). Pos+inser+ion, use the zero reference point for all measurements in order to maintain consistency. Accurate readings are essential,
Inherent in any line insertion is the possibility of infection.
Potential for infection related to portal for entry into systemic circulation, impaired skin integrity at Insertion site.
| Table 4.1 Nursing Responsibilities Before PA Catheter Insertion | ||
| A. | Explain the procedure step by step to the patient and family. Patients are frequently ill at ease if not told that: | |
| 1. | Face may be covered; | |
| 2. | Local anesthesia will be used; | |
| 3. | Pain is minimal; | |
| 4. | The line must remain in place for several days. | |
| B. | Do a preinsertion assessment: | |
| 1. | Document vital signs. | |
| 2. | Attach ECG electrodes and monitor recording. | |
| 3. | Review systems assessment if deemed necessary. | |
| C. | Collect equipment at the bedside. | |
| D. | Position patient for comfort and ease of access to venous entry site. | |
| E. | Prepare equipment for use: calibrate, test parts, flush as needed (Figs. 4.2, 4.3, 4.4, 4.5) | |
| F. | Mark zero reference point on the patient's chest with an indelible pen. | |
| G. | Open sterile materials and assist physician as needed with procedure. | |
| 1. | Monitor ECG during insertion; report signs of irritability as catheter passes through right ventricle. | |
| 2. | Flush and check patency as insertion is completed. | |
| 3. | Record readings with balloon inflated (PCWP) and deflated. | |
|
|
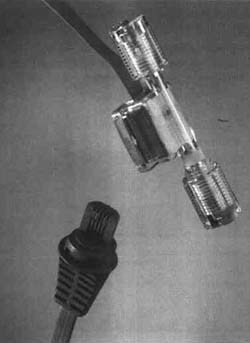
Figure 4.2 COBE disposable transducer. |
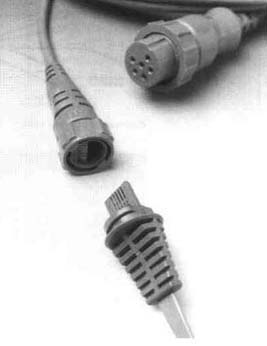
Figure 4.3 COBE cable. |
|
|
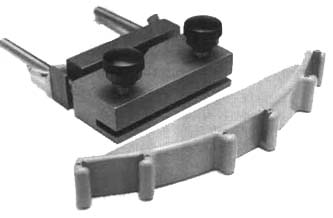
Figure 4.4 COBE brackets. |
Figure 4.5 COBE push button flush device. |
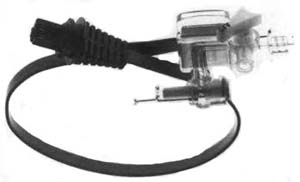
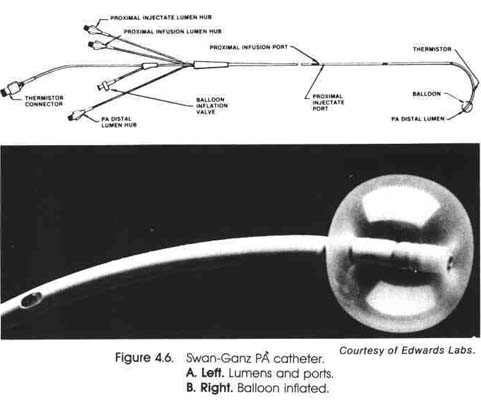
Pulmonary artery pressure monitoring is a direct measure of pressure within the pulmonary and cardiac vasculature. A flow-directed, balloon-tipped catheter is floated into the pulmonary artery via the right atrium, the right ventricle, and the pulmonary artery (Fig. 4.2). This allows for constant monitoring of the patient. The pulmonary artery catheter in Figure 4.2 is an example of this type of balloon-tipped catheter. The insertion is usually performed at the bedside via an antecubital cutdown.
As the catheter passes through the heart chambers, moving toward the pulmonary artery, measurements are recorded and waveforms displayed. Systolic and diastolic pressures of each area are measured as the catheter passes through. After initial insertion into the RA with a deflated balloon, air is inserted into the balloon to assist in floating the catheter to the pulmonary artery. PA systolic pressure reflects the peak pressure in the right ventricle. PA diastolic pressure is the lowest pressure reached in the pulmonary artery. The average between systolic and diastolic PA pressures is the mean pressure. The balloon at the tip of the catheter remains inflated to read the pulmonary artery pressures. The catheter becomes wedged into a small branch of the pulmonary artery. Pressure readings following wedging, pulmonary artery wedge (PAW), reflect pressure distal to the wedge. The measurement reflects pulmonary venous, left atrial, and left ventricular pressure at the end of diastole (LVEDP).30 During diastole, blood flows from the pulmonary arteries through the pulmonary capillaries, the left atrium, and the open mitral valve to the left ventricle.
|
The PAW measurement is a direct reflection of the left atrium and an indirect measurement of the left ventricle. An increased wedge pressure may be an indicator that LVEDP is rising and the heart may be failing. At the end of diastole, pulmonary artery diastolic pressure (PAD) is equal to left atrial pressure (LAP), which is equal to left ventricular end diastolic pressure (LVEDP), or (PAD = LAP = LVEDP). The hemodynamic status of the patient can be determined by end diastolic pressure of a ventricle, which indirectly measures the pumping ability of the ventricle. An increased PAW pressure must be evaluated to determine if failure is present or if the increased pressure is the result of increased volume and fluid overload. The patient's clinical status (i.e., lab reports, physical assessment) is important to evaluate at this time also.
|
|
|
Figure 4.7 Pressur trace when catheter tip is in right atrium. |
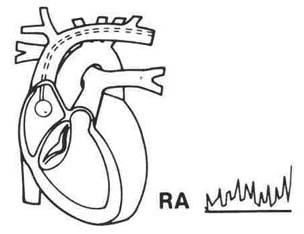
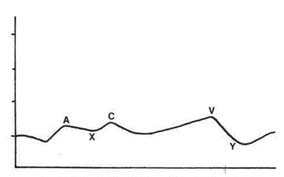
Pressure changes in the right atrium during systole and diastole are quite small. RA systolic is slightly greater than RA diastolic pressure the RA systolic pressure becomes greater pressure in the right ventricle (RV), the valve closes. These pressure changes are recorded as waveforms (Fig. 4.4). The positive waves are x, x1, and y. The a wave is a small pressure rise produced by atrial contract. The x descending wave following the a wave signifies the slight drop in pressure during atrial diastole. This wave is aided by a downward pull on the atrioventricular (AV) valves when ventricular contraction begins. The c wave may appear as a notch on the a wave or as a separate wave, or it may be superimposed on the a wave. Closure of the tricuspid valve, pushed into the right atrium during atrial diastole, produces the c wave. It is a reflection of a very slight increase in right atrial pressure. The X1 is the negative wave immediately following the c wave. The x1 represents atrial-ventric-ular movement during ventricular contraction. The x wave is frequently not identified in a tracing. The v wave is produced by blood entering the atrium during ventricular contraction, or right atrial diastole, and represents an increase in atrial pressure. The negative y wave follows the v wave and is produced by the opening of the tricuspid valve as blood moves from the right atrium to the right ventricle. It appears immediately before right atrial systole. Right atrial pressure is written as an average, or mean, of the wave (atrial systole) and the v wave (atrial diastole), which closely resemble each other. The normal right atrial pressure is 2-6 mm/Hg12 (Table 4.2).
|
|
|
Figure 4.8 Right atril waveform components. |
| Table 4.2 Normal Pulmonary Artery Pressures | |||
| Right atrium (RA) | |||
| RA mean | 2-6 mm/Hg | ||
| A wave - atrial systole | 5-6 mm/Hg | ||
| C wave - atrial diastole | 3-8 mm/Hg | ||
| V wave - tricuspid closure | 4-6 mm/Hg | ||
| Right ventricle (RV) | |||
| Mean | 20-30 mm/Hg | ||
| RV end diastole | 2-6 mm/Hg | ||
| Pulmonary artery (PA) | |||
| Mean | 10-20 mm/Hg | ||
| Diastole (end diastole) | 10-20 mm/Hg | ||
| Systole | 20-30 mm/Hg | ||
| Pulmonary artery wedge (PAW) | |||
| Mean | 10-20 mm/Hg | ||
Abnormalities in waveforms of the right atrium occur in any condition that increases the resistance to right ventricular filling. The a wave appears elevated when the right atrium is called on to increase systolic pressure.
Problems demanding an increase in RA systolic pressure can be (1) tricuspid stenosis with narrowing of the valve; (2) right ventricular hypertrophy; (3) changes in the myocardium that prevent complete relaxation; and (4) cardiac tamponade. Direct left atrial pressure usually cannot be measured at the bedside. It can, however, be measured after open heart surgery, with lines placed during the surgical procedure. This measure can be taken in the cardiac catheterization laboratory with a special trans-septal catheter passed from the right to the left atrium. The v wave, reflecting right atrial diastole and right ventricular contraction, will be elevated when the RA filling pressure is increased. Tricuspid insufficiency with an incompetent valve that remains open during right ventricular contraction allows regurgitation into the atrium, producing a rise in pressure, seen as an elevated v wave. An absent c wave occurs in the presence of tricuspid insufficiency. The c wave is produced by the closed valve being pulled into the right atrium during ventricular systole. The c wave is not produced when the valve leaflets do not close properly.12
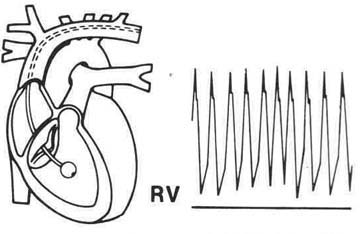
Right ventricular pressure (RVP) (Fig. 4.5) is measured only as the PA line is being inserted. The ventricular waveform is of greater magnitude than the atrial wave because it records ventricular systolic pressure generated by the contraction of the ventricle. The waveform appears as a large spike. Diastolic ventricular pressure is quite similar to atrial pressure. Right ventricular systolic pressure is normally 20-30 mm/Hg. Elevation of this pressure results from pulmonary hypertension, pulmonary stenosis, or ventricular septal defect (VSD). Right ventricular systolic and pulmonary artery systolic pressures are nearly equal. With right heart failure, tamponade, or pericarditis, the right ventricular diastolic pressure is elevated, as is systolic pressure. Left ventricular failure is also reflected with increased right ventricular end diastolic pressure. End diastolic pressure represents end diastolic volume. Normal right ventricular end diastolic pressure is 2-6 mm/Hg.
|
|
|
Figure 4.9 Pressure trace when catheter tip is in right ventricle . |
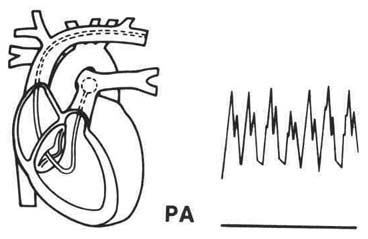
The pressure waveform of the pulmonary artery (Fig. 4.6) differs in configuration because of the pulmonic valve. The pressure tracing is seen as a sharp upstroke, followed by a gradual downstroke, which is interrupted by a slight rise on the downstroke, labeled the dicrotic notch. It signifies the closure of the pulmonic valve and the onset of diastole. With the catheter in the pulmonary artery and a deflated balloon, systolic, diastolic, and mean PA pressures can be measured. Systole begins when the pulmonic valve opens and blood enters the PA rapidly. As pressure in the RV drops below the PA pressure, the pulmonic valve closes. This valve closure produces the dicrotic notch. Normal systolic PA pressure is 20-30 mm/Hg, diastolic pressure is 10-20 mm/Hg, and mean pressure is 10-20 mm/Hg. Diastolic PA pressure refers to the end diastolic pressure. The PA end diastolic pressure is nearly equal to the end diastolic pressure in the left ventricle (LVEDP).
|
|
|
Figure 4.10 Pressure trace when catheter tip is in pulmonary artery. |
Mean PA pressure is closer to diastolic than to systolic. It is not a true mean because systolic pressure makes up only one-third of the cardiac cycle; the diastolic component makes up the other two-thirds of the cardiac cycle. The larger diastolic component influences PA pressure. When heart rate increases, the diastolic component is shortened, lengthening with slower heart rates. The systolic component is changed very minimally. The mean PA pressure is influenced by increased or decreased heart rate due to the shortening or lengthening of the diastolic component of the cycle.
PA pressure reflects pulmonary vascular resistance and pulmonary blood volume. A low PA pressure may indicate hypovolemia. Elevated PA pressure may occur as a result of increased pulmonary vascular resistance due to obstructed blood flow or increased pulmonary blood volume resulting from problems with fluid overload, left ventricular failure, or mitral valve disease.
Abnormalities of PA waveforms occur as a result of left heart problems, or pulmonary vascular disease. PAD is the most revealing PA pressure, as LVEDP is reflected by this pressure reading. Pulmonary hypertension causes elevation of PAD, pulmonary artery systolic pressure (PAS), and mean PA. The pulmonary capillary wedge pressure (PCWP) remains normal. Pulmonary vascular disease, left ventricular failure, and mitral stenosis cause elevation of PA pressure, reflected in the waveforms (Fig. 4.7). The a wave of the left atrium is elevated if mitral stenosis occurs. The narrowed valve requires increased left atrium systolic pressure. This reflects an increased PAD pressure due to the increased contractile force of the atrium. Pathology is revealed by the pressure tracing difference between PA and LVEDP.
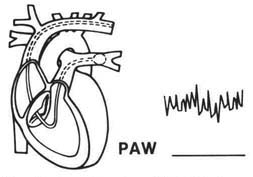
The PA catheter is floated into a small branch of the PA, where the balloon is inflated. Inflation occludes flow, thereby shutting off the pressure behind it in the segment of the PA. This, in turn, allows for measurement of pressures forward of the catheter, the actual pressures in the pulmonary capillaries. This is termed pulmonary artery wedge (PAW) or pulmonary capillary wedge pressure (PCWP) (Fig. 4.8).
There are no valves between the occluded segment of the PA capillaries and the left atrium, so PCWP measures events, of the left heart, reflecting left atrial mean pressure and left ventricular end diastolic pressure. The normal pressure for PCWP is 6-12 mm/Hg. A change of 4 mm/Hg is clinically significant. The pressure tracing for PCWP is like that of the left atrium waveform. The a wave of atrial contraction and the v wave for ventricular systole are seen; the c wave (mitral valve pull) is not seen because it is too small.
|
|
|
Figure 4.11 Extremely elevated PA. |
PCWP is low when hypovolemic states occur, either from decreased fluid or vasodilatation. Elevated PCWP occurs with increased preload or afterload, secondary to left ventricle pump failure or increased pulmonary or systemic resistance interfering with ejection. A decrease in the heart's ability to contract will also cause PCWP to rise. To better understand the relationship of these pressure readings, it is best to view the circulation from PA to left ventricle (LV) as one chamber. At the point in the cardiac cycle when the left ventricle is filling, the mitral valve is open, and the left heart is one chamber. At this point, mean left atrium (LA) pressure and LV end diastolic pressure are about equal—4-12 mm/Hg. The pulmonary capillary bed shares the same pressure as there are no valves between the structures. With the pulmonic valve closed, pressure in the capillaries should be very similar to PA end diastolic pressure—normally within 5 mm/Hg of wedge pressure. This assumes an absence of pulmonary problems, such as hypertension.
|
|
|
Figure 4.12 Pressure trace when catheter tip is in pulomonary capillary wedge position. |
The a wave of PCWP, reflecting left atrium contraction, will be elevated if the systolic pressure of the atrium is increased (Fig. 4.9). An example of this is mitral stenosis, which requires greater force from the atrium to propel blood into the ventricle. The v wave of PCWP also reflects atrial diastole and ventricular contraction of the left heart. Problems causing LA diastolic pressure elevation will be reflected by v wave elevation. Mitral regurgitation with an LA backflow increases LA pressure reflected by the v wave of the wedge tracing.12, 36
Cardiac output is measured with a PA catheter that has a thermister—a temperature indicator on the end. It is the measurement of the amount of blood ejected by the heart, recorded in liters per minute (L/ m). CO is the product of heart rate times stroke volume (HR x SV = CO). This measure is dependent on circulatory blood volume and the functioning of the left ventricle. CO measures the status of the entire cardiovascular system.
Stroke volume, the amount of blood ejected with each heart beat, is dependent on several factors: (1) preload—the volume of blood in the ventricle just before contraction, or the end diastolic volume; (2) contractility—an inherent property of the heart; and (3) afterload—the resistance to ejection from the ventricles.
|
|
|
Figure 4.13 PA to PAW; Elevated pressures. |
Normal cardiac output at rest is 4-8 L/m. CO measurement procedures are carried out at the bed side with a PA thermodilution catheter in place (Table 4.3). Protocols differ in institutions. In some areas, the nursing staff in the critical care unit carries out the measurement procedure. In others, the nurse gathers the equipment and fills the syringes, and the physician injects the fluid. Whichever protocol is used, the procedure requires a sterile solution, iced or roomtemperature saline, or D5W at a recorded start temperature. A computer is used for measurement. Five or 10 ml of the solution are drawn into plastic syringes (usually five syringes are used). Syringes with finger rings are ideal for this procedure because the temperature of the solution may be altered with hand contact. After solution is drawn into the syringe, it is placed in an ice container. A temperature probe is placed in an extra solution-filled syringe barrel to ensure temperature accuracy of the injectate. The solution must be injected rapidly into the right atrial or proximal port. Usually three to five readings are taken, and the average is calculated. The temperature change of the blood is measured as it passes from the right atrial port to the tip of the catheter in the PA.
Changes in preload, after load, peripheral resistance, and contractility can influence CO (Table 4.4). Hemorrhage and dehydration reduce venous return.
| Table 4.3 Steps to Measure Cardiac Output | |
| 1. | Gather all equipment to be used. |
| 2. | Fill five syringes with 5-10 mm of sterile D5W or NS. |
| 3. | Place syringes in an ice container, |
| 4. | Place a temperature probe in an extra solution-filled syringe barrel to ensure temperature accuracy of the injectate. |
| 5. | Inject solution very rapidly into the right atrial or proximal port. |
| 6. | Take 3-5 readings and calculate the average. |
Patients receiving mechanical ventilation with positive pressure breathing have a reduced CO as a result of the increased intrathoracic pressure, reducing venous return. Myocardial ischemia, or decreased functional areas of the myocardium as aftermath of MI, or ventricular aneurysm reduce the contractile ability of the heart. Acidosis, electrolyte imbalance, cardiomyopathies, and ventricular fibrillation or standstill will also effectively alter the heart's contractile ability. Depressant drugs such as beta blocking agents decrease contractile activity. Obstructions to filling, such as cardiac tamponade and valvular stenosis, affect contractility and lower CO, as do extremes of tachycardia, which limit ventricular filling time. Congestive heart failure, which compromises pumping ability in the heart, is a major cause of low CO.
Afterload problems influence CO. The peripheral vascular system is primarily responsible for increased afterload. Decreased CO follows when afterload precipitates failure and the heart is unable to pump effectively to eject blood against the added resistance. Pulmonary hypertension and massive pulmonary embolism are responsible for increased right ventricular afterload; increased vasoconstriction and systemic hypertension are responsible for increased left ventricular afterload.
Preload influences on CO result from additional end diastolic volume. This reduces CO because the ventricles are unable to pump effectively. Increased preload with reduced CO occurs with intracardiac shunts, fluid overload, chordae tendinae rupture, incompetent valves, and severe bradycardia.
Metabolic demand with increased oxygen consumption is one cause of high CO. Although CO is high, the demand is not met. High output failure is a problem in febrile states, anemia, septic shock, hyperthyroidism, and several forms of stress. High CO occurs in septic shock as a result of massive vasodilatation from the toxic substances, with reduced peripheral resistance. Increased CO with reduced peripheral resistance also occurs when potent antihypertensive medication is administered.
| Table 4.4 Influences on Cardiac Output | ||||||
| Reduced output | ||||||
| A. | Reduced venous return | |||||
| 1. | reduced preload | |||||
| a. | hemorrhage | |||||
| b. | dehydration | |||||
| 2. | assisted ventilation—increased intrathoracic pressure | |||||
| a. | positive end expiratory pressure | |||||
| B. | Reduced myocardial contractility | |||||
| 1. | myocardial ischemia | |||||
| 2. | myocardial infarction | |||||
| 3. | ventricular aneurysm | |||||
| 4. | acidosis | |||||
| 5. | electrical imbalance | |||||
| 6. | cardiomyopathy | |||||
| 7. | ventricular fibrillation | |||||
| 8. | asystole | |||||
| 9. | depressant drugs | |||||
| a. | beta blockers | |||||
| 10. | obstruction to filling | |||||
| a. | tamponade | |||||
| b. | valvular | |||||
| C. | Reduced filling time | |||||
| 1. | tachycardia | |||||
| D. | Congestive heart failure | |||||
| 1. | compromised pumping ability | |||||
| 2. | increased afterload | |||||
| a. | pulmonary hypertension | |||||
| b. | pulmonary embolism | |||||
| c. | vasoconstriction | |||||
| d. | systemic hypertension | |||||
| 3. | increased preload | |||||
| a. | added diastolic volume | |||||
| 1) | intracardiac shunt | |||||
| 2) | fluid overload | |||||
| 3) | rupture chordae tendinae | |||||
| 4) | incompetent valves | |||||
| 5) | severe bradycardia | |||||
| Increased output | ||||||
| A. | Metabolic demand | |||||
| 1. | increased oxygen consumption | |||||
| 2. | febrile state | |||||
| 3. | anemia | |||||
| 4. | septic shock | |||||
| 5. | hyperthyroidism | |||||
| 6. | stress reactions | |||||
| B. | Reduce peripheral resistance | |||||
| 1. | potent antihypertensive | |||||
| 2. | vasodilatation | |||||
Another hemodynamic parameter is blood pressure. Arterial lines are used to monitor patients following cardiac surgery, to draw blood for repeated arterial blood gas reports, to monitor blood pressure in unstable patients receiving vasopressor or potent vasodilatory medications, and to monitor patients with vascular problems or fluid imbalance. Continuous blood pressure monitoring is accomplished with a catheter placed percutaneously in the radial, brachial, or femoral artery. The patency of the line is maintained with a pressure bag. A blood pump bag is placed around an IV infusion solution (heparinized D5W or saline). The bag is maintained at 300 mm/Hg pressure to ensure constant infusion without a backup. The infusion rate is set at 3 ml/minute.
A baseline pressure should be obtained before the line is inserted. Normal arterial pressure varies (Table 4.5). The normal adult arterial pressure ranges from 90/60 mm/Hg to 140/90 mm/Hg. Mean arterial pressure is the average pressure in the vascular system during the cardiac cycle. The normal mean pressure is from 70-90 mm/Hg, depending on where the line is placed. Lines distal to the aorta reflect higher systolic pressure with a variance of 20 mm/Hg in the femoral artery.
The waveform for an arterial line shows a sharp upstroke, a gradual downstroke, and a well-documented dicrotic notch. The dicrotic notch appears in the waveform as a result of a pressure rise when the aortic valve closes.
Complications of arterial monitoring can be:
Priorities for nursing care of a patient with a pulmonary artery catheter are (preinsertion):
Patient education for the procedure;
Preparation of all equipment;
Preparation of the skin;
Performance of an Alien's test for artery occlusion if the radial artery is to be used.
Postinsertion responsibilities include:
Assessments for complications;
Maintenance of a patent line;
Blood pressure monitoring and recording, as indicated;
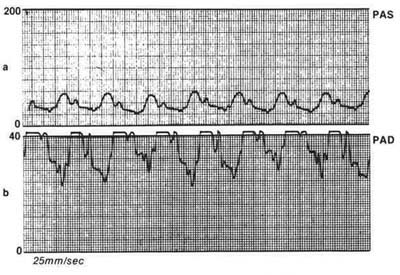
Measurement of PA mean, PAD, PAS, PCWP, and CO pressures, as ordered; in acute situation, measure every hour.
Equipment necessary to monitor PA pressures are:
Potential for infection related to portal for entry into systemic circulation and the heart, impaired skin integrity at catheter site.