1.
Weight Management Overview
Statistics Related to Overweight and Obesity
Nearly two-thirds of adults in the United States are overweight, and 30.5 percent are obese, according to data from the 1999-2000 National Health and Nutrition Examination Survey (NHANES). This fact sheet presents statistics on the prevalence of overweight and obesity in the U.S., as well as their disease, mortality, and economic costs. To understand these statistics, it is necessary to know how overweight and obesity are defined and measured. This fact sheet also explains why statistics from different sources may not match.
Overweight and obesity are known risk factors for:
| diabetes | |
| heart disease | |
| stroke | |
| hypertension | |
| gallbladder disease | |
| osteoarthritis (degeneration of cartilage and bone of joints) | |
| sleep apnea and other breathing problems | |
| some forms of cancer (uterine, breast, colorectal, kidney, and gallbladder) |
Obesity is also associated with:
| high blood cholesterol | |
| complications of pregnancy | |
| menstrual irregularities | |
| hirsutism (presence of excess body and facial hair) | |
| stress incontinence (urine leakage caused by weak pelvic-floor muscles) | |
| psychological disorders such as depression | |
| increased surgical risk |
What are overweight and obesity?
Overweight refers to an excess of body weight compared to set standards. The excess weight may come from muscle, bone, fat, and/or body water. Obesity refers specifically to having an abnormally high proportion of body fat.[1] A person can be overweight without being obese, as in the example of a bodybuilder or other athlete who has a lot of muscle. However, many people who are overweight are also obese.
How are overweight and obesity measured?
A number of methods are used to determine if someone is overweight or obese. Some are based on the relation between height and weight; others are based on measurements of body fat. The most commonly used method today is body mass index (BMI).
BMI can be used to screen for both overweight and obesity in adults. It is the measurement of choice for many obesity researchers and other health professionals, as well as the definition used in most published information on overweight and obesity. BMI is a calculation based on height and weight, and it is not gender-specific. BMI does not directly measure percent of body fat, but it is a more accurate indicator of overweight and obesity than relying on weight alone.
BMI is found by dividing a person's weight in kilograms by height in meters squared. The mathematical formula is: weight (kg) / height squared (m²).
To determine BMI using pounds and inches, multiply your weight in pounds by 704.5,* then divide the result by your height in inches, and divide that result by your height in inches a second time. (Or you can use the BMI calculator at http://www.nhlbisupport.com/bmi/, or check the chart shown below that has calculated BMI for you.)
An expert panel convened by the National Heart, Lung, and Blood Institute (NHLBI) in cooperation with the National Institute of Diabetes and Digestive and Kidney Diseases (NIDDK), both part of the National Institutes of Health (NIH) identified overweight as a BMI of 2529.9 kg/m², and obesity as a BMI of 30 kg/m² or greater. However, overweight and obesity are not mutually exclusive, since people who are obese are also overweight.[1] Defining overweight as a BMI of 25 or greater is consistent with the recommendations of the World Health Organization [2] and most other countries.
Calculating BMI is simple, quick, and inexpensive but it does have limitations. One problem with using BMI as a measurement tool is that very muscular people may fall into the "overweight" category when they are actually healthy and fit. Another problem with using BMI is that people who have lost muscle mass, such as the elderly, may be in the "healthy weight" category according to their BMI when they actually have reduced nutritional reserves. BMI, therefore, is useful as a general guideline to monitor trends in the population, but by itself is not diagnostic of an individual patient's health status. Further evaluation of a patient should be performed to determine his or her weight status and associated health risks.
Because BMI does not show the difference between fat and muscle, it does not always accurately predict when weight could lead to health problems. For example, someone with a lot of muscle (such as a body builder) may have a BMI in the unhealthy range, but still be healthy and have little risk of developing diabetes or having a heart attack. BMI also may not accurately reflect body fatness in people who are very short (under 5 feet) and in older people, who tend to lose muscle mass as they age. But for most people, BMI is a reliable way to tell if your weight is putting your health at risk.
The multiplier 704.5 is used by the National Institutes of Health. Other organizations may use a slightly different multiplier; for example, the American Dietetic Association suggests multiplying by 700. The variation in outcome (a few tenths) is insignificant.
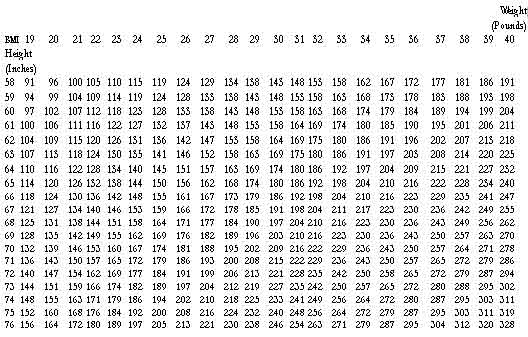
Body Mass Index Table
To use the table, find the appropriate height in the left-hand column labeled Height. Move across to a given weight. The number at the top of the column is the BMI at that height and weight. Pounds have been rounded off.
Waist Circumference
Excess weight, as measured by BMI, is not the only risk to your health. So is the location of fat on your body. If you carry fat mainly around your waist, you are more likely to develop health problems than if you carry fat mainly in your hips and thighs. This is true even if your BMI falls within the normal range. Women with a waist measurement of more than 35 inches or men with a waist measurement of more than 40 inches may have a higher disease risk than people with smaller waist measurements because of where their fat lies.
To measure your waist circumference, place a tape measure around your bare abdomen just above your hip bone. Be sure that the tape is snug, but does not compress your skin, and is parallel to the floor. Relax, exhale, and measure your waist.
Why do statistics about overweight and obesity differ?
The definitions or measurement characteristics for overweight and obesity have varied over time, from study to study, and from one part of the world to another. The varied definitions affect prevalence statistics and make it difficult to compare data from different studies. Prevalence refers to the total number of existing cases of a disease or condition in a given population at a given time. Some overweight- and obesity-related prevalence rates are presented as crude or unadjusted estimates, while others are age-adjusted estimates. Unadjusted prevalence estimates are used to present cross-sectional data for population groups at a given point or time period. For age-adjusted rates, statistical procedures are used to remove the effect of age differences in populations that are being compared over different time periods. Unadjusted estimates and age-adjusted estimates will yield slightly different values.
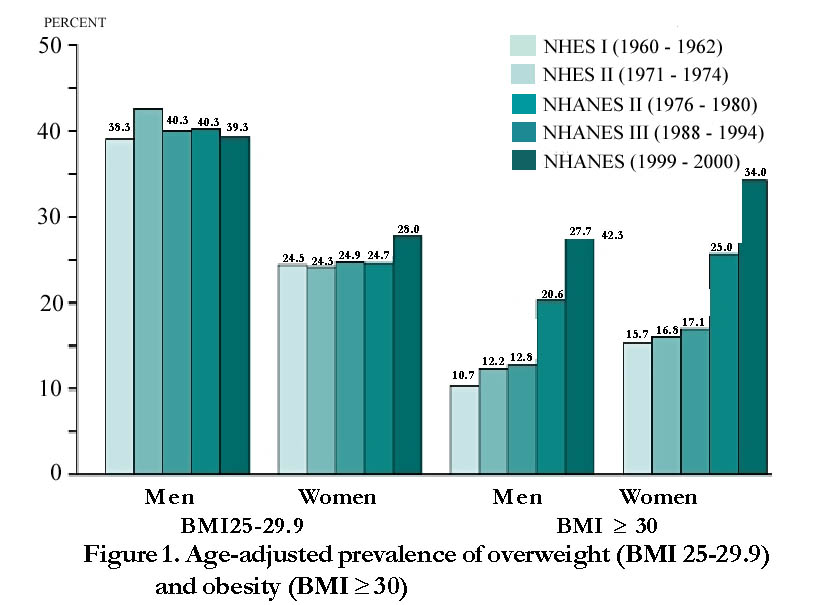
Previous studies in the United States have used the 1959 or the 1983 Metropolitan Life Insurance tables of desirable weight-for-height as the reference for overweight.[3] More recently, many Government agencies and scientific health organizations have estimated overweight using data from a series of cross-sectional surveys called the National Health Examination Surveys (NHES) and the National Health and Nutrition Examination Surveys (NHANES). The National Center for Health Statistics (NCHS) of the Centers for Disease Control and Prevention (CDC) conducted these surveys. Each had three cycles: NHES I, II, and III spanned the period from 1960 to 1970, and NHANES I, II, and III were conducted in the 1970's, 1980's, and early 1990's. Since 1999, NHANES has become a continuous survey.
Many reports in the literature use a statistically derived definition of overweight from NHANES II (19761980). This definition (based on the gender-specific 85th percentile values of BMI for 20 to 29 year olds) is a BMI greater than or equal to (³) 27.3 for women and 27.8 for men. NHANES II further defines "severe overweight" (based on 95th percentile values) as BMI ³ 31.1 for men and BMI ³ 32.2 for women.[4] Some studies round these numbers to a whole number, which affects the statistical prevalence. In 1995, the World Health Organization recommended a classification for three "grades" of overweight using BMI cutoff points of 25, 30, and 40.[5] The International Obesity Task Force suggested an additional cutoff point of 35 and slightly different terminology.[6]
The expert panel convened by NHLBI and NIDDK released a report in June 1998, that provided definitions for overweight and obesity similar t those used by the World Health Organization. The panel identified overweight as a BMI ³ 25 to less than (<)30, and obesity as a BMI ³ 30. These definitions, widely used by the Federal government and increasingly by the broader medical and scientific communities, are based on evidence that health risks increase more steeply in individuals with a BMI ³ 25.
BMI cutoff points are a guide for definitions of overweight and obesity and are useful for comparative purposes across populations and over time; however, the health risks associated with overweight and obesity are on a continuum and do not necessarily correspond to rigid cutoff points. For example, an overweight individual with a BMI of 29 does not acquire additional health consequences associated with obesity simply by crossing the BMI threshold > 30. However, health risks generally increase with increasing BMI.
Prevalence Statistics Related to Overweight and Obesity
Overweight and obesity are found worldwide, and the prevalence of these conditions in the United States ranks high along with other developed nations. Approximately 300,000 adult deaths in the United States each year are attributable to unhealthy dietary habits and physical inactivity or sedentary behavior.[7]
Below are some frequently asked questions and answers about overweight and obesity statistics. Data are based on NHANES 1999-2000. Unless otherwise specified, the figures given represent age-adjusted estimates. Population numbers are based on the U.S. Census Bureau Census 2000.
How many adults are overweight?
Nearly two-thirds of U.S. adults are overweight (BMI ³ 25, which includes those who are obese).[8]
| All adults (20+ years old): 129.6 million (64.5 percent) | |
| Women (20+ years old): 64.5 million (61.9 percent) | |
| Men (20+ years old): 65.1 million (67.2 percent) |
How many adults are obese?
Nearly one-third of U.S. adults are obese (BMI ³ 30).[8]
| All adults (20+ years old): 61.3 million (30.5 percent) | |
| Women (20+ years old): 34.7 million (33.4 percent) | |
| Men (20+ years old): 26.6 million (27.5 percent) |
How many adults are at a healthy weight?
Less than half of U.S. adults have a healthy weight (BMI ³ 18.5 to < 25).[9]
| All adults (20-74 years old): 67.3 million (33.5 percent) | |
| Women (20-74 years old): 36.7 million (35.3 percent) | |
| Men (20-74 years old): 30.6 million (31.8 percent) |
How has the prevalence of overweight and obesity in adults changed over the years?
The prevalence has steadily increased over the years among both genders, all ages, all racial/ethnic groups, all educational levels, and all smoking levels.10 From 1960 to 2000, the prevalence of overweight (BMI ³ 25 to £ 30) increased from 31.5 to 33.6 percent in U.S. adults aged 20 to 74.[9] The prevalence of obesity (BMI ³ 30) during this same time period more than doubled from 13.3 to 30.9 percent, with most of this rise occurring in the past 20 years.[8] From 1988 to 2000, the prevalence of extreme obesity (BMI ³ 40) increased from 2.9 to 4.7 percent, up from 0.8 percent in 1960.[3,8] In 1991, four states had obesity rates of 15 percent or higher, and none had obesity rates above 16 percent. By 2000, every state except Colorado had obesity rates of 15 percent or more, and 22 states had obesity rates of 20 percent or more.[11] The prevalence of overweight and obesity generally increases with advancing age, then starts to decline among people over 60.[3]
What is the prevalence of overweight and obesity in minorities?
The age-adjusted prevalence of combined overweight and obesity (BMI ³ 25) in racial/ethnic minorities especially minority women is generally higher than in whites in the United States.[8]
| Non-Hispanic Black women: 77.3% | |
| Mexican American women: 71.9% | |
| Non-Hispanic White women: 57.3% | |
| Non-Hispanic Black men: 60.7% | |
| Non-Hispanic White men: 67.4% |
(Statistics are for populations 20+ years old.)
Studies using this definition of overweight and obesity provide ethnicity-specific data only for these three racial-ethnic groups. Studies using definitions of overweight and obesity from NHANES II have reported a high prevalence of overweight and obesity among Hispanics and American Indians. The prevalence of overweight (BMI ³ 25) and obesity (BMI ³ 30) in Asian Americans is lower than in the population as a whole.[1]
What is the prevalence of overweight and obesity in children and adolescents?
While there is no generally accepted definition for obesity as distinct from overweight in children and adolescents, the prevalence of overweight is increasing for children and adolescents in the United States. Approximately 15.3 percent of children (ages 611) and 15.5 percent of adolescents (ages 1219) were overweight in 2000. An additional 15 percent of children and 14.9 percent of adolescents were at risk for overweight (BMI for age between the 85th and 95th percentile).
What is the prevalence of diabetes in people who are overweight or obese?
Among people diagnosed with type 2 (noninsulin-dependent) diabetes, 67 percent have a BMI ³ 27 and 46 percent have a BMI ³ 30.[14] About 17 million people in the U.S. have type 2 diabetes, accounting for more than 90 percent of diabetes cases.[15] An additional 20 million have impaired glucose tolerance, sometimes called pre-diabetes, which is a strong risk factor for developing diabetes later in life. An estimated 70 percent of diabetes risk in the U.S. can be attributed to excess weight.[16] For more statistics on diabetes, go to: www.diabetes.niddk.nih.gov/dm/pubs/statistics/index.htm.
What is the prevalence of hypertension (high blood pressure) in people who are overweight or obese?
The age-adjusted prevalence of hypertension in overweight U.S. adults is 22.1 percent for men with BMI ³ 25 and < 27; 27.0 percent for men with BMI ³ 27 and < 30; 27.7 percent for women with BMI ³ 25 and < 27; and 32.7 percent for women BMI ³ 27 and < 30. In comparison, the prevalence of hypertension in adults who are not overweight (BMI <25) is 14.9 percent for men and 15.2 percent for women. The prevalence in adults who are obese (BMI ³ 30) is 41.9 percent for men and 37.8 percent for women.[17] (Hypertension is defined as mean systolic blood pressure ³ 140 mm Hg, mean diastolic ³ 90 mm Hg, or currently taking antihypertensive medication).
What is the prevalence of high blood cholesterol in people who are overweight or obese?
The age-adjusted prevalence of high blood cholesterol (³ 240 mg/dL) in overweight U.S. adults is 19.1 percent for men with BMI ³ 25 and < 27; 21.6 percent for men with BMI ³ 27 and < 30; 30.5 percent for women with BMI ³ 25 and < 27; and 29.6 percent for women BMI ³ 27 and < 30. In comparison, the prevalence of high cholesterol in adults who are not overweight (BMI <25) is 13.0 percent for men and 13.4 percent for women. The prevalence for adults who are obese (BMI ³ 30) is 22.0 percent for men and 27.0 percent for women.[17]
What is the prevalence of cancer in people who are overweight or obese?
While direct prevalence information is not available, a recent study found that people whose BMI was 40 or more had death rates from cancer that were 52 percent higher for men and 62 percent higher for women than rates for normal-weight men and women. Overweight and obesity could account for 14 percent of cancer deaths among men and 20 percent among women in the U.S. In both men and women, higher BMI is associated with higher death rates from cancers of the esophagus, colon and rectum, liver, gallbladder, pancreas, and kidney. The same trend applies to cancers of the stomach and prostate in men and cancers of the breast, uterus, cervix, and ovaries in women.[18] Almost half of post-menopausal women diagnosed with breast cancer have a BMI ³ 29.19 In one study (the Nurses' Health Study), women gaining more than 20 pounds from age 18 to midlife doubled their risk of breast cancer, compared to women whose weight remained stable.[20]
What is the mortality rate associated with obesity?
Most studies show an increase in mortality rate associated with obesity (BMI ³ 30). Obese individuals have a 50 to 100 percent increased risk of death from all causes, compared with normal-weight individuals (BMI 2025). Most of the increased risk is due to cardiovascular causes.[21] Life expectancy of a moderately obese person could be shortened by 2 to 5 years. White men between 20 and 30 years old with a BMI ³ 45 could shorten their life expectancy by 13 years; white women in the same category could lose up to 8 years of life. Young African American men with a BMI ³ 45 could lose up to 20 years of life; African American women, up to 5.[22]
Economic Costs Related to Overweight and Obesity
As the prevalence of overweight and obesity has increased in the United States, so have related health care costsboth direct and indirect. Direct health care costs refer to preventive, diagnostic, and treatment services (for example, physician visits, medications, and hospital and nursing home care). Indirect costs are the value of wages lost by people unable to work because of illness or disability, as well as the value of future earnings lost by premature death.
Most of the statistics presented below represent the economic cost of overweight and obesity in the United States in 1995, updated to 2001 dollars.[23] Unless otherwise noted, the statistics given are adapted from Wolf and Colditz,24 who based their data on existing epidemiological studies that defined overweight and obesity as a BMI ³ 29. Because the prevalence of overweight and obesity has increased since 1995, the costs today are higher than the figures given here.
What is the cost of overweight and obesity?
Total cost: $117 billion , direct cost: $61 billion, indirect cost: $56 billion (comparable to the economic costs of cigarette smoking).
A recent study estimated annual medical spending due to overweight and obesity (BMI ³ 25) to be as much as $92.6 billion in 2002 dollars (9.1 percent of U.S. health expenditures).[25]
What is the cost of heart disease related to overweight and obesity?
Direct cost: $8.8 billion (17 percent of the total direct cost of heart disease, independent of stroke).
What is the cost of type 2 diabetes related to overweight and obesity?
Total cost: $98 billion (in 2001).[16]
What is the cost of osteoarthritis related to overweight and obesity?
Total cost: $21.2 billion, direct cost: $5.3 billion, indirect cost: $15.9 billion.
What is the cost of hypertension (high blood pressure) related to overweight and obesity?
Direct cost: $4.1 billion (17 percent of the total cost of hypertension).
What is the cost of gallbladder disease related to overweight and obesity?
Total cost: $3.4 billion, direct cost: $3.2 billion, indirect cost: $187 million.
What is the cost of cancer related to overweight and obesity?
Breast cancer: Total cost: $2.9 billion, direct cost: $1.1 billion, indirect cost: $1.8 billion.
Endometrial cancer: Total cost: $933 million, direct cost: $310 million, indirect cost: $623 million..
Colon cancer: Total cost: $3.5 billion, direct cost: $1.3 billion, indirect cost: $2.2 billion.
What is the cost of lost productivity related to obesity?
The cost of lost productivity related to obesity (BMI ³ 30) among Americans ages 1764 is $3.9 billion. This value considers the following annual numbers (for 1994):
| Workdays lost related to obesity: 39.3 million | |
| Physician office visits related to obesity: 62.7 million | |
| Restricted activity days related to obesity: 239.0 million | |
| Bed-days related to obesity: 89.5 million |
Other Statistics Related to Overweight and Obesity
How much do we spend on weight-loss products and services?
Americans spend $33 billion annually on weight-loss products and services.[26] (This figure represents consumer dollars spent in the early 1990's on all efforts at weight loss or weight maintenance including low-calorie foods, artificially sweetened products such as diet sodas, and memberships to commercial weight-loss centers.)
How physically active is the U.S. population?
Less than one-third (31.8 percent) of U.S. adults get regular leisure-time physical activity (defined as light or moderate activity five times or more per week for 30 minutes or more each time and/or vigorous activity three times or more per week for 20 minutes or more each time). About 10 percent of adults do no physical activity at all in their leisure time.[27]
About 25 percent of young people (ages 1221 years) participate in light to moderate activity (e.g., walking, bicycling) nearly every day. About 50 percent regularly engage in vigorous physical activity. Approximately 25 percent report no vigorous physical activity, and 14 percent report no recent vigorous or light to moderate physical activity.[28]
What is the cost of lack of physical activity?
The direct cost of physical inactivity may be as high as $24.3 billion.[29]
What are the benefits of physical activity?
In addition to helping to control weight, physical activity decreases the risk of dying from coronary heart disease and reduces the risk of developing diabetes, hypertension, and colon cancer.[28]
References
- Clinical Guidelines on the Identification, Evaluation, and Treatment of Overweight and Obesity in Adults. National Institutes of Health, National Heart, Lung, and Blood Institute. June 1998.
- World Health Organization. Obesity: Preventing and managing the global epidemic. Report of a WHO Consultation on Obesity, Geneva, 3-5 June, 1997. World Health Organization. Geneva 1998.
- Flegal KM, Carroll MD, Kuczmarski RJ, Johnson CL. Overweight and obesity in the United States: Prevalence and trends, 1960_1994. International Journal of Obesity. 1998;22:39_47.
- Kuczmarski RJ, Flegal KM. Criteria for definition of overweight in transition: Background and recommendations for the United States. American Journal of Clinical Nutrition. 2000;72:1074-1081.
- Physical status: The use and interpretation of anthropometry. Report of a WHO Expert Committee. World Health Organization: Geneva, 1995 (WHO Technical Report Series; 854).
- International Obesity Task Force. Managing the global epidemic of obesity. Report of the WHO Consultation on Obesity, Geneva, June 5_7, 1997. World Health Organization: Geneva.
- U.S. Department of Health and Human Services. The Surgeon General's Call to Action to Prevent and Decrease Overweight and Obesity, 2001.
- Flegal KM, Carroll MD, Ogden CL, Johnson CL. Prevalence and trends in obesity among US adults, 1999-2000. Journal of the American Medical Association. 2002;288:1723-1727.
- Pastor PN, Makuc DM, Reuben C, Xia H. Chartbook on Trends in the Health of Americans. Health, United States, 2002. Hyattsville, MD: National Center for Health Statistics. 2002.
- Mokdad AH, Ford ES, Bowman BA, Dietz WH, Vinicor F, Bales VS, Marks JS. Prevalence of obesity, diabetes, and obesity-related health risk factors, 2001. Journal of the American Medical Association. 2003;289(1):76-79.
- Mokdad AH, Bowman BA, Ford ES, Vinicor F, Marks JS, Koplan JP. The continuing epidemics of obesity and diabetes in the United States. Journal of the American Medical Association. 2001;286(10):1195-1200.
- Ogden CL, Flegal KM, Carroll MD, Johnson CL. Prevalence and trends in overweight among US children and adolescents, 1999-2000. Journal of the American Medical Association. 2002;288:1728-1732.
- Kuczmarski RJ, Ogden CL, Guo SS, et al. 2000 CDC growth charts for the United States: Methods and development. National Center for Health Statistics. Vital Health Statistics 11(246). 2002.
- Personal communication from Maureen I. Harris, NIDDK/NIH, to Susan Z. Yanovski, NIDDK/NIH, 1999.
- Centers for Disease Control and Prevention. National diabetes fact sheet: General information and national estimates on diabetes in the United States, 2000. Atlanta, GU.S. Department of Health and Human Services, Centers for Disease Control and Prevention, 2002.
- National Institute of Diabetes and Digestive and Kidney Diseases. Diabetes Prevention Program Meeting Summary. August 2001. Diabetes Mellitus Interagency Coordinating Committee
- Brown CD, Higgins M, Donato KA, Rohde RC, Garrison R, Obarzanek E, Ernst ND, Horan M. Body mass index and prevalence of hypertension and dyslipidemia. Obesity Research. 2000;8(9):605-619
- Calle EE, Rodriguez C, Walker-Thurmond K, Thun MJ. Overweight, obesity, and mortality from cancer in a prospectively studied cohort of U.S. adults. New England Journal of Medicine. 2003;348(17):1625-1638.
- Ballard-Barbash R, Swanson CA. Body weight: Estimation of risk for breast and endometrial cancers. American Journal of Clinical Nutrition. 1996;63(suppl):437S_441S.
- Huang Z, Hankinson SE, Colditz GA, et al. Dual effects of weight and weight gain on breast cancer risk. Journal of the America Medical Association. 1997;278:1407_1411.
- Clinical Guidelines on the Identification, Evaluation, and Treatment of Overweight and Obesity in Adults—The Evidence Report. National Institutes of Health. Obesity Research. 1998;6 (suppl)2:51S-209S.
- Fontaine KR, Redden DT, Wang C, Westfall AO, Allison DB. Years of life lost due to obesity. Journal of the American Medical Association. 2003;289(2):187-93.
- Wolf, AM, Manson JE, Colditz GA. The Economic Impact of Overweight, Obesity and Weight Loss. In: Eckel R, ed. Obesity: Mechanisms and Clinical Management. Lippincott, Williams and Wilkins; 2002.
- Wolf AM, Colditz GA. Current estimates of the economic cost of obesity in the United States. Obesity Research. March 1998; 6(2):97_106.
- Finkelstein EA, Fiebelkorn IC, Wang G. National medical spending attributable to overweight and obesity: How much, and who's paying? Health Affairs Web Exclusive. 2003;W3:219-226. Available at www.healthaffairs.org/WebExclusives/Finkelstein_Web_Excl_051403.htm.
- Colditz GA. Economic costs of obesity. American Journal of Clinical Nutrition. 1992;55:503-507s.
- Barnes MA, Schoenborn CA. Physical activity among adults: United States, 2000. National Center for Health Statistics. Advance Data. 2003;(333).
- U.S. Department of Health and Humans Services. Physical Activity and Health: A Report of the Surgeon General. Centers for Disease Control and Prevention. 1996.
- Colditz GA. Economic costs of obesity and inactivity. Medicine & Science in Sports & Exercise. 1999; S663-S667.